Uncategorized October 8, 2025

Why Home Prices Aren’t Actually Flat

If you’ve been following real estate news lately, you’ve probably seen headlines saying home prices are flat. And at first glance, that sounds simple enough. But here’s the thing. The reality isn’t relatively that straightforward.

In most places, prices aren’t flat at all.

What the Data Really Shows

While we’ve definitely seen prices moderate from the rapid and unsustainable climb of 2020-2022, the extent of the change will vary significantly everywhere.

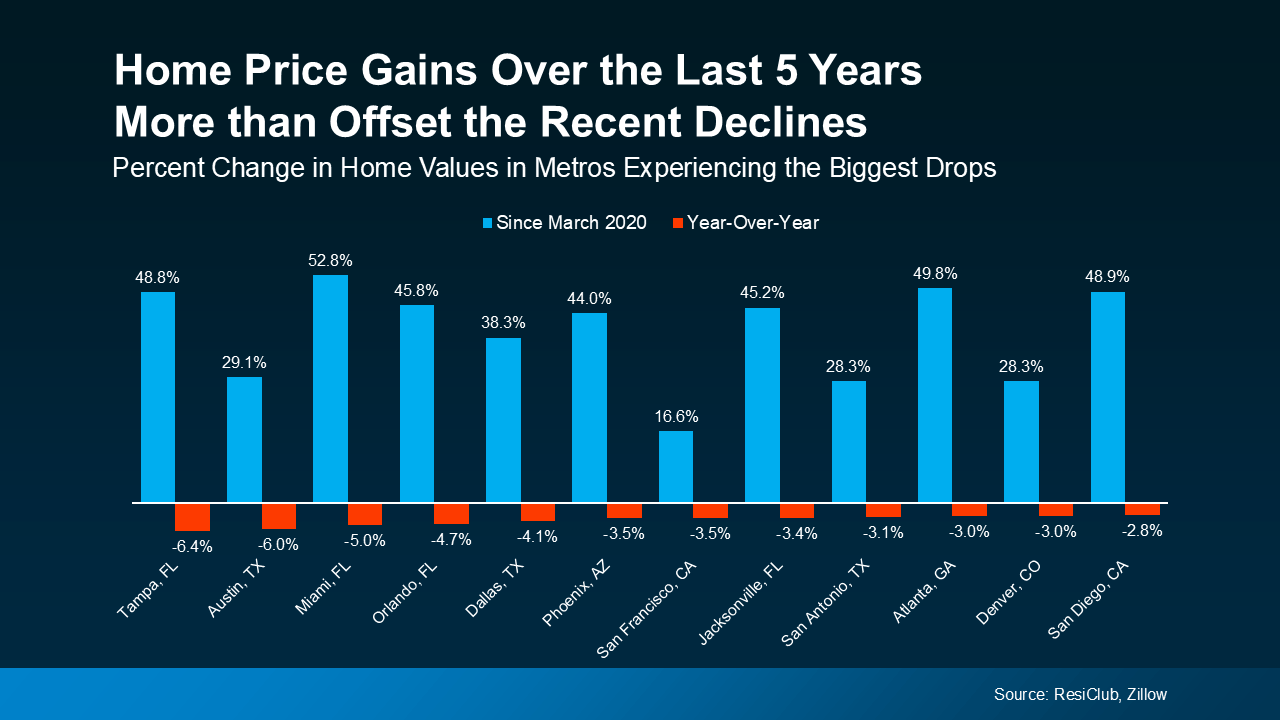
Examining data from ResiClub and Zillow for the 50 largest metropolitan areas reveals this trend clearly. The real story is split right down the middle. Half of the metros are still seeing prices inch higher. The other half? Prices are coming down slightly (see graph below).

a graph of prices on a dark backgroundThe big takeaway here is “flat” doesn’t mean prices are holding steady everywhere. What the numbers actually show is how much price trends vary depending on your location.

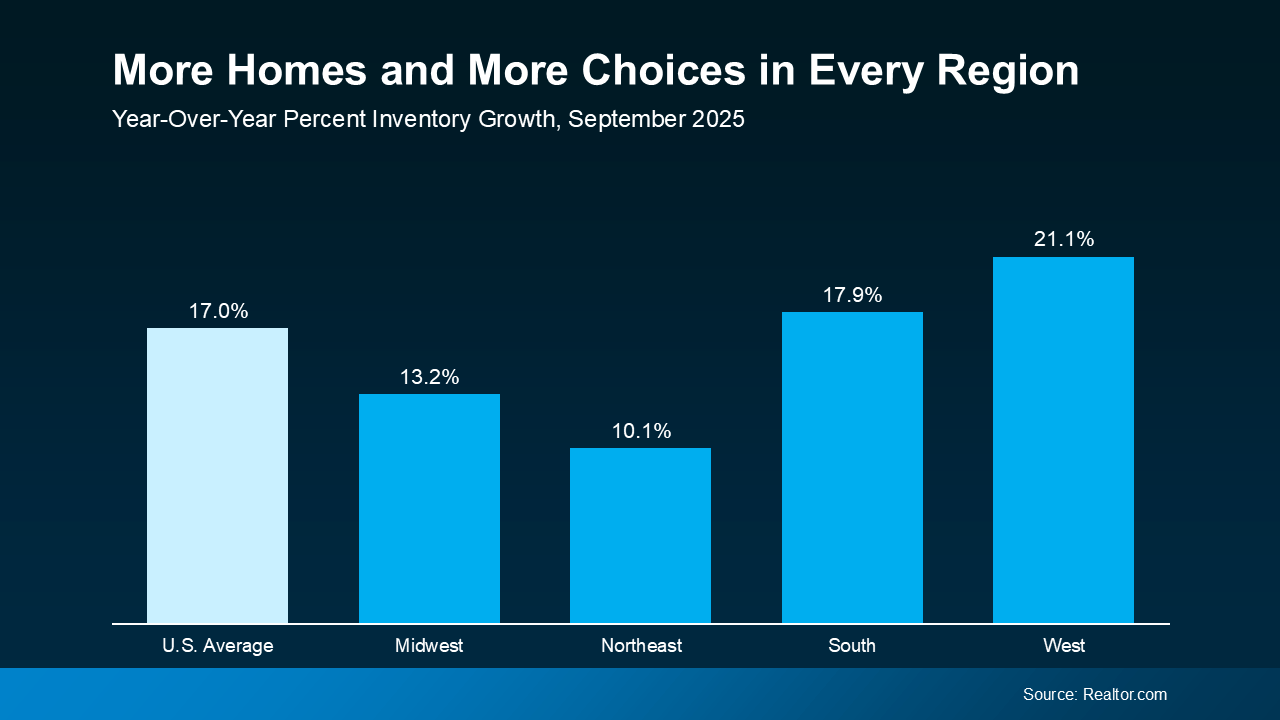
One factor that’s driving the divide? Inventory. The Joint Center for Housing Studies (JCHS) of Harvard University explains:

“ . . . price trends are beginning to diverge in markets across the country. Prices are declining in a growing number of markets where inventories have soared while they continue to climb in markets where for-sale inventories remain tight.”

When you average those very different trends together, you get a number that appears to be flat. However, it doesn’t reveal the whole story, and it’s not what most markets are experiencing today. You deserve more than that.

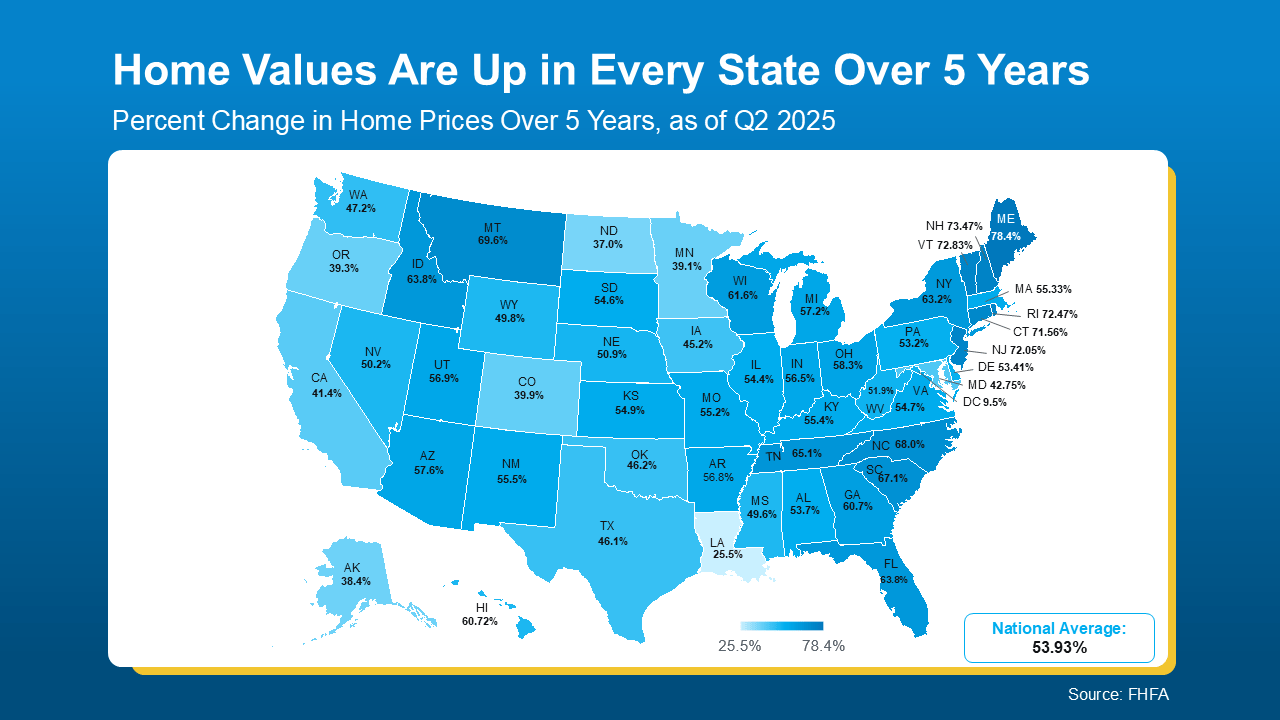
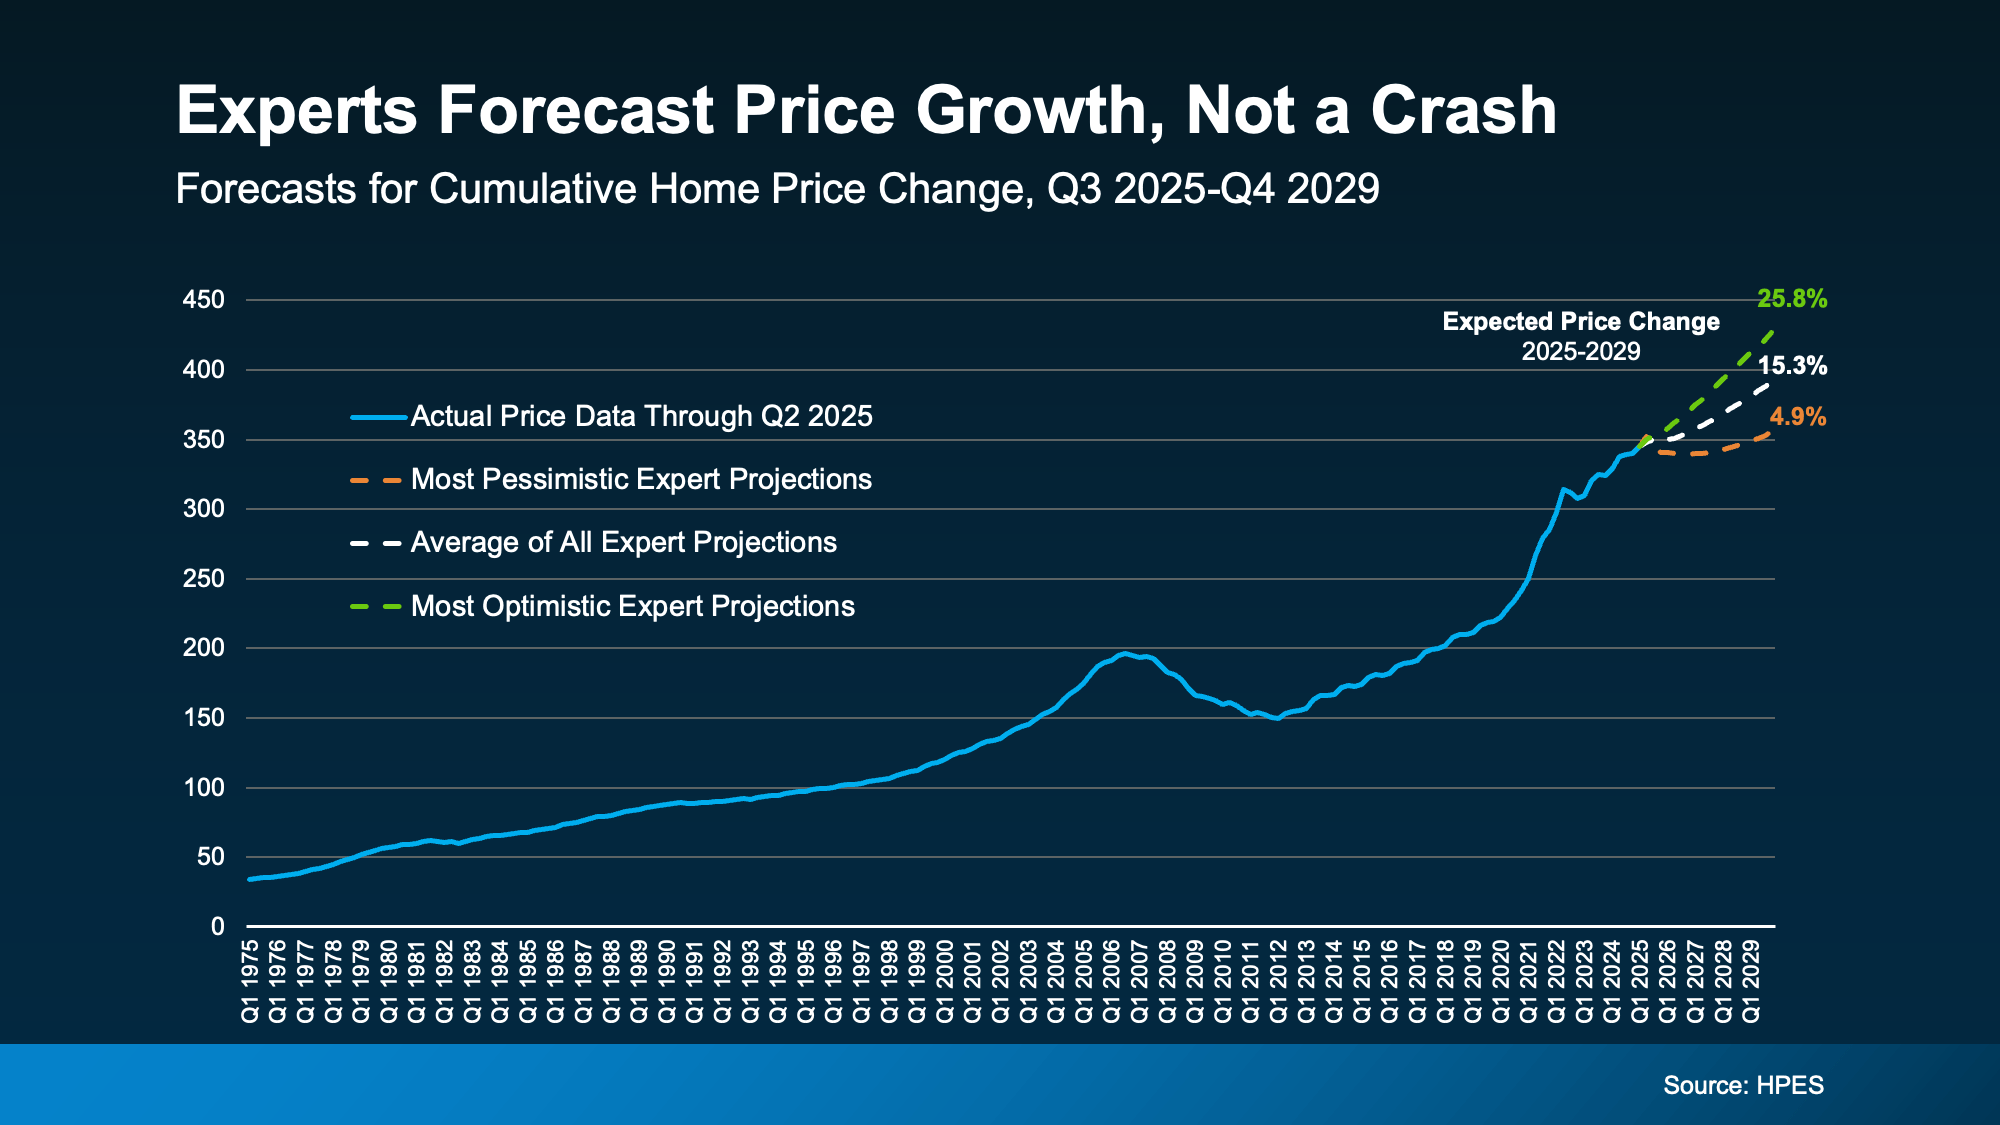
And just in case you’re really focusing on the declines, remember those are primarily places where prices rose too much, too fast, just a few years ago. Prices have increased by roughly 50% nationally over the past five years, and even more in some markets experiencing a larger correction today. So, a modest drop in some local pockets still puts most of those homeowners ahead when it comes to the overall value of their home. Based on the fundamentals of today’s housing market, experts do not project a national decline in the future.

So, what’s actually essential for you to know?

If You’re Buying…

You need to know what’s happening in your area because that’s going to influence everything from how quickly you need to make an offer to how much negotiating power you’ll have once you do.

  • In a market where prices are still rising, waiting around could mean paying more in the long run.
  • In a market where they’re easing, you may be able to ask for things like repairs or closing cost help to sweeten the deal.

The bottom line? Knowing your local trend puts you in the driver’s seat.

If You’re Selling…

You’ll want to be aware of local trends, so you know how to price your house and what you can expect to negotiate.

  • In a market where prices are still rising, you may not need to make many compromises to get your home sold.
  • However, if you’re in a market where prices are decreasing, setting the right price from the start and being willing to negotiate becomes even more crucial.

The oversized action item for homeowners? Sellers need to have an agent’s local perspective if they want to avoid making the wrong call on pricing – and homes that are priced right are definitely selling.

The Real Story Is Local

The national averages can provide helpful context for broad trends. However, sometimes you need a local perspective because what’s happening in your zip code may look different. As Anthony Smith, Senior Economist at Realtor.com, puts it:

“While national prices continued to climb, local market conditions have become increasingly fragmented…This regional divide is expected to continue influencing price dynamics and sales activity as the fall season gets underway.

That’s why the most brilliant move, whether you’re buying or selling, is to lean on a local agent who’s an expert on your market.

They’ll have the data and experience to tell you whether prices in your area are holding steady, moving up, or softening slightly – and how that could impact your move.

Bottom Line

Headlines calling home prices flat may be grabbing attention, but they’re not giving you the whole picture.

Has anyone taken the time to walk you through what we’re seeing right here, right now?

If you want the real story about what prices are doing in our market, let’s connect.

Uncategorized October 7, 2025

Do You Know the Minimum Down Payment for a Conventional Home Loan?

Uncategorized October 6, 2025

Why Experts Say Mortgage Rates Should Ease Over the Next Year

You want mortgage rates to fall – and they’ve started to. But is it going to last? And how low will they go?

Experts say there’s room for rates to come down even more over the next year. One of the leading indicators to watch is the 10-year Treasury yield. Here’s why.

The Link Between Mortgage Rates and the 10-Year Treasury Yield

For over 50 years, the 30-year fixed mortgage rate has closely followed the movement of the 10-year treasury yield, which is a widely watched benchmark for long-term interest rates (see graph below):

a graph of a graph showing the rise of a mortgage rateWhen the treasury yield climbs, mortgage rates tend to follow. And when the yield falls, mortgage rates typically come down.

It’s been a predictable pattern for over 50 years. So predictable that several experts consider the gap between the two normal. It’s known as the spread, and it typically averages around 1.76 percentage points, or approximately 176 basis points.

The Spread Is Shrinking

Over the past couple of years, though, that spread has been much wider than usual. Why? Think of the spread as a measure of fear in the market. When there’s lingering uncertainty in the economy, the gap widens beyond its usual norm. That’s one of the reasons why mortgage rates have been unusually high over the past few years.

But here’s a sign for optimism. Even though there’s still some lingering uncertainty related to the economy, that spread is starting to shrink as the path forward is becoming clearer (see graph below):

a graph of a chartAnd that opens the door for mortgage rates to come down even more. As a recent article from Redfin explains:

“A lower mortgage spread equals lower mortgage rates. If the spread continues to decline, mortgage rates could fall more than they already have.”

The 10-Year Treasury Yield Is Expected To Decline

It’s not just the spread, though. The 10-year Treasury yield itself is also forecast to decline in the months ahead. So, when you combine a lower yield with a narrowing spread, you have two key forces potentially pushing mortgage rates down going into next year.

This long-term relationship is a significant reason why experts currently project that mortgage rates will ease, with a slight possibility that they may reach the upper 5s by the end of next year.

Here’s how it works. Take the 10-year treasury yield, which is sitting at about 4.09% at the time this article is being written, and then add the average spread of 1.76%. From there, you’d expect mortgage rates to be around 5.85% (see graph below):

a graph of a chartHowever, remember that all of this can change as the economy shifts. And be aware that there will be ups and downs along the way.

How these dynamics play out will depend on where the economy, the job market, inflation, and more go from here. However, the 2026 outlook is currently expected to be a gradual decline in mortgage rates. And as of now, things are starting to move in the right direction.

Bottom Line

Keeping up with all of these shifts can feel overwhelming. That’s why having an experienced agent or lender on your side matters. They’ll do the heavy lifting for you.

If you want real-time updates on mortgage rates, let’s connect so you have someone to keep you informed and help you plan your next move.

Uncategorized October 2, 2025

Why October Is the Best Time To Buy a Home in 2025

If you’ve been watching from the sidelines, now’s the time to lean in. It’s officially the best time to buy this year. According to Realtor.com, this October will have the most buyer-friendly conditions of any month in 2025:

“By mid-October, buyers across much of the country may finally find the combination of inventory, pricing, and negotiating power they’ve been waiting for—a rare opportunity in a market that has been tight for most of the past decade.”

So, if you’re ready and able to buy right now, shooting for this month means you should see:

  • More homes to choose from
  • Less competition from other buyers
  • More time to browse
  • Better home prices
  • Sellers who are more willing to negotiate

Just remember, every market is different. For most of the top 50 largest metros, that sweet spot falls in October. However, the optimal time to buy may be slightly earlier or later, depending on your location. As Realtor.com explains:

“While Oct. 12–18 is the national “Best Week,” timing can shift depending on the local markets. . .”

Best Week To Buy for the Top 50 Largest Metro Areas

  • Atlanta-Sandy Springs-Roswell, GA: September 28 – October 4
  • Austin-Round Rock-San Marcos, TX: September 28 – October 4
  • Baltimore-Columbia-Towson, MD: October 12 – 18
  • Birmingham, AL: October 19 – 25
  • Boston-Cambridge-Newton, MA-NH: October 26 – November 1
  • Buffalo-Cheektowaga, NY: October 12 – 18
  • Charlotte-Concord-Gastonia, NC-SC: November 2 – 8
  • Chicago-Naperville-Elgin, IL-IN: September 28 – October 4
  • Cincinnati, OH-KY-IN: October 12 – 18
  • Cleveland, OH: October 12 – 18
  • Columbus, OH: October 12 – 18
  • Dallas-Fort Worth-Arlington, TX: September 28 – October 4
  • Denver-Aurora-Centennial, CO: October 12 – 18
  • Detroit-Warren-Dearborn, MI: October 12 – 18
  • Grand Rapids-Wyoming-Kentwood, MI: September 28 – October 4
  • Hartford-West Hartford-East Hartford, CT: September 21 – 27
  • Houston-Pasadena-The Woodlands, TX: October 12 – 18
  • Indianapolis-Carmel-Greenwood, IN: October 26 – November 1
  • Jacksonville, FL: October 26 – November 1
  • Kansas City, MO-KS: October 12 – 18
  • Las Vegas-Henderson-North Las Vegas, NV: October 5 – 11
  • Los Angeles-Long Beach-Anaheim, CA: October 12 – 18
  • Louisville/Jefferson County, KY-IN: November 2 – 8
  • Memphis, TN-MS-AR: September 21 – 27
  • Miami-Fort Lauderdale-West Palm Beach, FL: November 30 – December 6
  • Milwaukee-Waukesha, WI: September 7 – 13
  • Minneapolis-St. Paul-Bloomington, MN-WI: October 26 – November 1
  • Nashville-Davidson–Murfreesboro–Franklin, TN: October 12 – 18
  • New York-Newark-Jersey City, NY-NJ: September 14 – 20
  • Oklahoma City, OK: October 12 – 18
  • Orlando-Kissimmee-Sanford, FL: October 26 – November 1
  • Philadelphia-Camden-Wilmington, PA-NJ-DE-MD: September 7 – 13
  • Phoenix-Mesa-Chandler, AZ: November 2 – 8
  • Pittsburgh, PA: October 12 – 18
  • Portland-Vancouver-Hillsboro, OR-WA: October 26 – November 1
  • Providence-Warwick, RI-MA: October 19 – 25
  • Raleigh-Cary, NC: October 12 – 18
  • Richmond, VA: October 26 – November 1
  • Riverside-San Bernardino-Ontario, CA: September 28 – October 4
  • Sacramento-Roseville-Folsom, CA: October 12 – 18
  • San Antonio-New Braunfels, TX: October 12 – 18
  • San Diego-Chula Vista-Carlsbad, CA: October 12 – 18
  • San Francisco-Oakland-Fremont, CA: October 12 – 18
  • San Jose-Sunnyvale-Santa Clara, CA: October 19 – 25
  • Seattle-Tacoma-Bellevue, WA: October 19 – 25
  • St. Louis, MO-IL: October 12 – 18
  • Tampa-St. Petersburg-Clearwater, FL: November 30 – December 6
  • Tucson, AZ: October 12 – 18
  • Virginia Beach-Chesapeake-Norfolk, VA-NC: September 21 – 27
  • Washington-Arlington-Alexandria, DC-VA-MD-WV: October 12 – 18

What the Experts Are Saying

And Realtor.com isn’t the only one saying you’ve got an opportunity if you move now. Lawrence Yun, Chief Economist at the National Association of Realtors (NAR), explains:

Homebuyers are in the best position in more than five years to find the right home and negotiate for a better price. Current inventory is at its highest since May 2020, during the COVID lockdown.”

Daryl Fairweather, Chief Economist at Redfin, puts it like this:

Nationally, now is a good time to buy, if you can afford it . . . with falling mortgage rates and significantly more inventory, buyers have an upper hand in negotiations.”

And NerdWallet says:

“This fall just might be the best window for home buyers in the past five years.”

How To Get Ready for this Golden Window

To make sure you’re ready to jump in whenever your market’s best time to buy arrives, talk to a local agent now. They’ll be able to provide you with more information on your market’s peak time, explain why it’s beneficial for you, and outline the steps you’ll need to take to prepare.

Bottom Line

If you’re serious about buying, getting prepped for this October window is a clever play.

Want help lining up your strategy?Let’ss have a quick conversation so you’ve got the information you need to be ready for this prime buying time.

Uncategorized October 1, 2025

What Buyers Say They Need Most (And How the Market’s Responding)

A recent survey from Bank of America asked would-be homebuyers what would help them feel better about making a move, and it’s no surprise the answers have a clear theme. They want affordability to improve, specifically prices and rates (see below):

a graph of a couple of circles with textHere’s the good news. While the broader economy may still feel uncertain, there are signs that the housing market is showing some changes in both of those areas. Let’s break it down so you know what you’re working with.

Prices Are Moderating

Over the past few years, home prices have climbed rapidly, sometimes so quickly that it has left many buyers feeling shut out. But today, that pace has slowed down. For comparison, prices rose by 20% from 2020 to 2021 in a 12-month period. Now? Nationally, experts are projecting single-digit increases this year – a much more normal pace.

That’s a sharp contrast to the rapid growth we saw just a few short years ago. Just remember that price trends vary by area. In some markets, prices are expected to continue rising, while others are anticipated to experience slight declines.

Prices aren’t crashing, but they are moderating. For buyers, the slowdown makes buying a home a bit less intimidating. It’s easier to plan your budget when home values are moving at a much slower pace.

Mortgage Rates Are Easing

At the same time, rates have come down from their recent highs. And that’s taken some pressure off would-be homebuyers. As Lisa Sturtevant, Chief Economist at Bright MLS, says:

“Slower price growth coupled with a slight drop in mortgage rates will improve affordability and create a window for some buyers to get into the market.

Even a slight drop in mortgage rates can mean a big difference in what you pay each month in your future mortgage payment. Just remember, while rates have come down a bit lately, they’re going to experience some volatility. So don’t get too caught up in the ups and downs.

The overall trend in the year ahead is that rates are expected to remain in the low to mid-6s, which is significantly better than where they were just a few short months ago. They may even drop further, depending on the direction the economy takes from here.

Why This Matters

Although confidence in the economy may be low, the housing market is showing signs of adjustment. Prices are moderating, and rates have come down from their highs.

For you, that may not solve affordability challenges altogether, but it does mean conditions look a little different than they did earlier this year. And those shifts could help you re-engage as we move into next year.

Bottom Line

The top two concerns for buyers are seeing some movement. Prices are moderating. Rates are easing. And both trends could persist into 2026.

If you’re considering a move, let’s connect and walk you through what’s happening in our area – and what it means for your plans.

Uncategorized September 30, 2025

Closing Costs Unpacked: State-by-State Breakdowns for Today’s Buyers

If you’re planning to buy a home this year, there’s one expense you can’t afford to overlook: closing costs.

Almost every buyer is aware of them, but few know exactly what they cover or how different they can be depending on where you’re buying. So, let’s break them down.

What Are Closing Costs?

Your closing costs refer to the additional fees and payments you incur when finalizing your home purchase. Every buyer has them. According to Freddie Mac, they typically include things like homeowner insurance and title insurance, as well as various fees for your:

  • Loan application
  • Credit report
  • Loan origination
  • Home appraisal
  • Home inspection
  • Property survey
  • Attorney

National vs. Local: Why the Numbers Look So Different

When you search for information about closing costs online, you’ll often see a national range, usually 2% to 5% of the home’s purchase price. While that’s a helpful starting point if you’re working on your homebuying budget, it doesn’t tell the whole story. In reality, your closing costs will also vary based on:

  • Taxes and fees where you live (like transfer taxes and recording fees)
  • Service costs for things like title and attorney work in your local area

While the home price is obviously going to matter, state laws, tax rates, and even the going costs for title and attorney services can change what you expect to pay. That’s why it’s essential to consult with the professionals ahead of time so you know what to budget for. It can put you in control before you even start shopping.

To give you a rough ballpark, here’s a state-by-state look at typical closing costs right now based on those factors for the median-priced home in each state (see map below):

As the map shows, in some states, typical closing costs are roughly $ 1,000-$3,000. In a few places, they can be closer to $10-15K. That’s a big swing, especially if you’re buying your first home. And that’s why knowing what to expect matters.

If you want a real number to help with your budget, your best bet is to talk to a local agent and a lender. They can run the math for your price range, loan type, and exact location.

And just in case you’re looking at your state’s number and wondering if there’s any way to trim that bill, NerdWallet shares a few strategies that can help:

  • Negotiate with the seller. Ask for concessions, such as a credit toward your closing costs.
  • Shop around for homeowner’s insurance. Compare coverage and rates before committing.
  • Check for assistance programs. Some states, professions, and neighborhoods offer help. Your agent and lender can point you to what’s available locally.

Bottom Line

Closing costs are a key part of buying a home, but they can vary more than most people realize. Knowing your numbers (and how to bring them down potentially) can go a long way and help you feel confident about your purchase.

Let’s examine the typical closing costs in our area and provide you with a personalized estimate, allowing you to create your ideal budget.

Uncategorized September 29, 2025

Closing Costs Unpacked: State-by-State Breakdowns for Today’s Buyers

If you’re planning to buy a home this year, there’s one expense you can’t afford to overlook: closing costs.

Almost every buyer is aware of them, but not many know exactly what they cover or how different they can be based on where you’re buying. So, let’s break them down.

What Are Closing Costs?

Your closing costs refer to the additional fees and payments you incur when finalizing your home purchase. Every buyer has them. According to Freddie Mac, they typically include things like homeowner insurance and title insurance, as well as various fees for your:

  • Loan application
  • Credit report
  • Loan origination
  • Home appraisal
  • Home inspection
  • Property survey
  • Attorney

National vs. Local: Why the Numbers Look So Different

When you search for information about closing costs online, you’ll often see a national range, usually 2% to 5% of the home’s purchase price. While that’s a helpful starting point if you’re working on your homebuying budget, it doesn’t tell the whole story. In reality, your closing costs will also vary based on:

  • Taxes and fees where you live (like transfer taxes and recording fees)
  • Service costs for things like title and attorney work in your local area

While the home price is obviously going to matter, state laws, tax rates, and even the going costs for title and attorney services can change what you expect to pay. That’s why it’s essential to consult with the pros ahead of time so you know what to budget for. It can put you in control before you even start shopping.

To give you a rough ballpark, here’s a state-by-state look at typical closing costs right now based on those factors for the median-priced home in each state (see map below):

As the map shows, in some states, typical closing costs are roughly $ 1,000-$3,000. In a few places, they can be closer to $10-15K. That’s a big swing, especially if you’re buying your first home. And that’s why knowing what to expect matters.

If you want a real number to help with your budget, your best bet is to talk to a local agent and a lender. They can run the math for your price range, loan type, and exact location.

And just in case you’re looking at your state’s number and wondering if there’s any way to trim that bill, NerdWallet shares a few strategies that can help:

  • Negotiate with the seller. Ask for concessions, such as a credit toward your closing costs.
  • Shop around for homeowner’s insurance. Compare coverage and rates before committing.
  • Check for assistance programs. Some states, professions, and neighborhoods offer help. Your agent and lender can point you to what’s available locally.

Bottom Line

Closing costs are a key part of buying a home, but they can vary more than most people realize. Knowing your numbers (and how to bring them down potentially) can go a long way and help you feel confident about your purchase.

Let’s examine the typical closing costs in our area and provide you with a personalized estimate, allowing you to create your ideal budget.

Uncategorized September 25, 2025

Downsizing Without Debt: How More Homeowners Are Buying Their Next House in Cash

If you’ve been thinking about downsizing to lower your expenses, be closer to family, or make life easier, here’s a trend worth paying attention to:

More homeowners are buying their next house outright, without taking on a new mortgage. And, if you’ve owned your home for a while, you may be able to do the same. No mortgage. No monthly housing payments.

A Record Share of Homeowners Are Mortgage-Free

According to analysis from ResiClub of Census data, more than 40% of U.S. owner-occupied homes are mortgage-free – an all-time high for this data series. That means 4 in 10 homeowners own their homes free and clear (see graph below):

a graph of a number of blue barsOne big reason for this trend? Demographics. As Baby Boomers age and stay in their homes longer, many have had the opportunity to pay off their mortgages in full. You might be in that group too and not even realize just how much buying power you now have. It’s time to change that.

How Downsizers Are Turning Equity into Buying Power

As a homeowner, your equity is your most significant advantage in today’s market. If you’re mortgage-free (or close to it), it could give you the power to buy your next home in cash. That means you’d still have no mortgage payment in retirement, plus:

  • Less financial stress as you age
  • More cash flow, if you purchase a less expensive home
  • And it would likely be a faster, more straightforward transaction

Here’s how it works. You’d sell your current house and use the proceeds to buy your next home in cash. And while that may sound like something you thought would never be possible for you, it’s more realistic than you may think.

In the latest survey from John Burns Research and Consulting (JBREC) and Keeping Current Matters (KCM), agents reported that he share of purchases with all-cash buyers is climbing nationally. And those agents are seeing increases in almost every region of the country (see graph below):

a graph of salesFor Baby Boomers especially, buying in cash gives you more control over your next chapter. You could buy a smaller, less expensive home, which would result in lower costs, less upkeep, and more flexibility to enjoy what matters most. All while staying debt- and stress-free.

Because downsizing isn’t about downgrading your home, it’s about upgrading your quality of life. And that’s something worth exploring.

Bottom Line

You’ve worked hard for your home. Now it might be time for it to work hard for you.

Let’s discuss what your house is worth, and what it could unlock for you today. What would your ideal home look like if you were to downsize right now?

Uncategorized September 24, 2025

Why Buyers and Sellers Face Very Different Conditions Today

There’s a new divide in housing right now. In some states, buyers are gaining ground. In others, sellers still have the upper hand. It all depends on where you live. Curious what’s happening in your state?

These three maps illustrate how the split is unfolding across the country. In each one:

  • Darker Shades of Blue = Buyer-friendly
  • Lighter Shades of Blue = Seller strong

Inventory Sets the Stage

While the number of homes for sale has improved pretty much across the board, how much growth we’ve seen can look dramatically different based on where you live. And that impacts who has the leverage today.

This map uses data from Realtor.com to break it down:

  • The darker shades of blue show where inventory has risen more than in other areas of the country. Buyers here have more options to choose from and should have an easier time finding a home, thereby leveraging their negotiating power.
  • The lighter shades of blue are where inventory is still low. Sellers are more likely to sell quickly and make fewer concessions.

Prices Follow Inventory

The second map tracks how home prices are shifting by state. Just like above, you can see the divide taking shape. Many of the same areas are darker blue. That’s because there’s such a close tie between inventory and prices. When inventory rises, prices moderate.

  • The darker shades of blue indicate that prices are actually coming down slightly or remaining flat. With
  • more homes for sale, sellers may have to lower their prices or offer concessions to close a deal, which benefits budget-conscious buyers.
  • The lighter shades of blue indicate areas where prices are still rising due to low inventory. Sellers may still see buyers competing for homes, and that pushes prices higher.

Time on Market Tells the Same Story

Finally, here’s how quickly homes are selling state by state. See the colors? For the most part, they follow a similar general pattern, with many of the darker blues concentrated in the lower half of the country. And here’s why.

Generally speaking, as inventory increases, homes tend to sell more slowly. That’s why some areas with more inventory see homes take longer to sell.

  • The darker blues show where homes are staying on the market longer. That gives buyers more time and options, and signals sellers may need to adjust their expectations.
  • The lighter blues indicate areas where homes are still selling quickly. Sellers there may feel more confident, and buyers may need to act fast.

a map of the united statesThis explains why some sellers in these darker blue states are feeling frustrated when their listings linger, while others in tighter markets (like the lighter blue states) are still seeing their homes sell quickly.

Why an Agent’s Local Expertise Is the Key To Unlocking Today’s Market

Basically, the housing market is experiencing a divide. Conditions will vary significantly based on where you live, where you’re moving, and whether you’re buying or selling. While state-level information is helpful, what really matters is what’s happening in your town and neighborhood. And only a local agent truly has the information you need.

Bottom Line

Want to know what conditions look like in your neighborhood?

To understand which side of the market you’re on, let’s connect. We can walk through the numbers and what they mean for your next move.

Uncategorized September 22, 2025

3 Reasons Affordability Is Showing Signs of Improvement This Fall

For the past couple of years, it’s been tough for a lot of homebuyers to make the numbers work. Home prices shot up. Mortgage rates, too. And several people hit pause because it just didn’t feel possible. Maybe you were one of them.

But there’s some encouraging news. If you’ve been waiting for a better time to jump back in, affordability may finally be showing signs of improvement this fall.

The latest data from Redfin shows the typical monthly mortgage payment has been coming down, and is now about $290 lower than it was just a few months ago (see graph below):

a graph of a graph of a mortgage paymentAnd here’s why this is happening. The cost of buying a home really comes down to three things:

  • Mortgage rates
  • Home prices
  • Your wages

Right now, all three are finally moving in a better direction for you. While that doesn’t mean it’s suddenly easy to buy at today’s rates and prices, it does mean it’s not as challenging.

1. Mortgage Rates

Mortgage rates have come down compared to earlier this year. In May, they were roughly 7%. And now, they’re closer to 6.3% (see graph below):

a graph showing a line of interestThat may not sound like a big deal, but it does matter. Even small changes in rates can make a difference in your future monthly payment. Compared to when rates were 7%, if you take out an average $400K mortgage now at 6.3%, it’ll cost about $190 less a month based on just rates alone.

And for some people, that’s been enough to make repurchasing a home possible. As Joel Kan, VP and Deputy Chief Economist at the Mortgage Bankers Association (MBA), explained on September 10th:

The downward rate movement spurred the strongest week of borrower demand since 2022 . . . Purchase applications increased to the highest level since July and continued to run more than 20 percent ahead of last year’s pace.”

2. Home Prices

After several years of prices rising very rapidly, price growth has finally slowed. As Odeta Kushi, Deputy Chief Economist at First American, puts it:

“National home price growth remains positive, but muted — low single digits — and we expect this trend to continue in the second half of the year.

For buyers, that’s actually a significant relief. That moderation makes it easier to plan your budget. And in some markets, prices have even dipped slightly. If you’re in one of the markets, you may be able to find something that’s more affordable than you’d expect.

3. Wages

According to the Bureau of Labor Statistics (BLS), wages are up near 4% annually. Lawrence Yun, Chief Economist at NAR, explains why that number is so significant right now:

“Wage growth is now comfortably outpacing home price growth, and buyers have more choices.”

In other words, the typical paycheck is rising faster than home prices right now, which helps make buying a little more affordable. Now, it’s not a big difference, but in a market like this, every bit counts.

What This Means for You

Lower rates, slower price growth, and stronger wages might be enough to make the numbers finally work for you this fall.

While affordability is still tight, it’s a little easier on your wallet to buy now than it was just a few months ago. Remember, data from Redfin shows the typical monthly mortgage payment is already around $290 lower than it was earlier this year.

Bottom Line

Have you been wondering if it’s worth taking another look at buying?

Let’s run the numbers together. We can go over your budget, see what’s changed, and figure out if this fall is the time to turn window-shopping into key-turning.