
 Facebook
 X
X
 Pinterest
 Copy Link

There’s a new divide in housing right now. In some states, buyers are gaining ground. In others, sellers still have the upper hand. It all depends on where you live. Curious what’s happening in your state?
These three maps illustrate how the split is unfolding across the country. In each one:
- Darker Shades of Blue = Buyer-friendly
- Lighter Shades of Blue = Seller strong
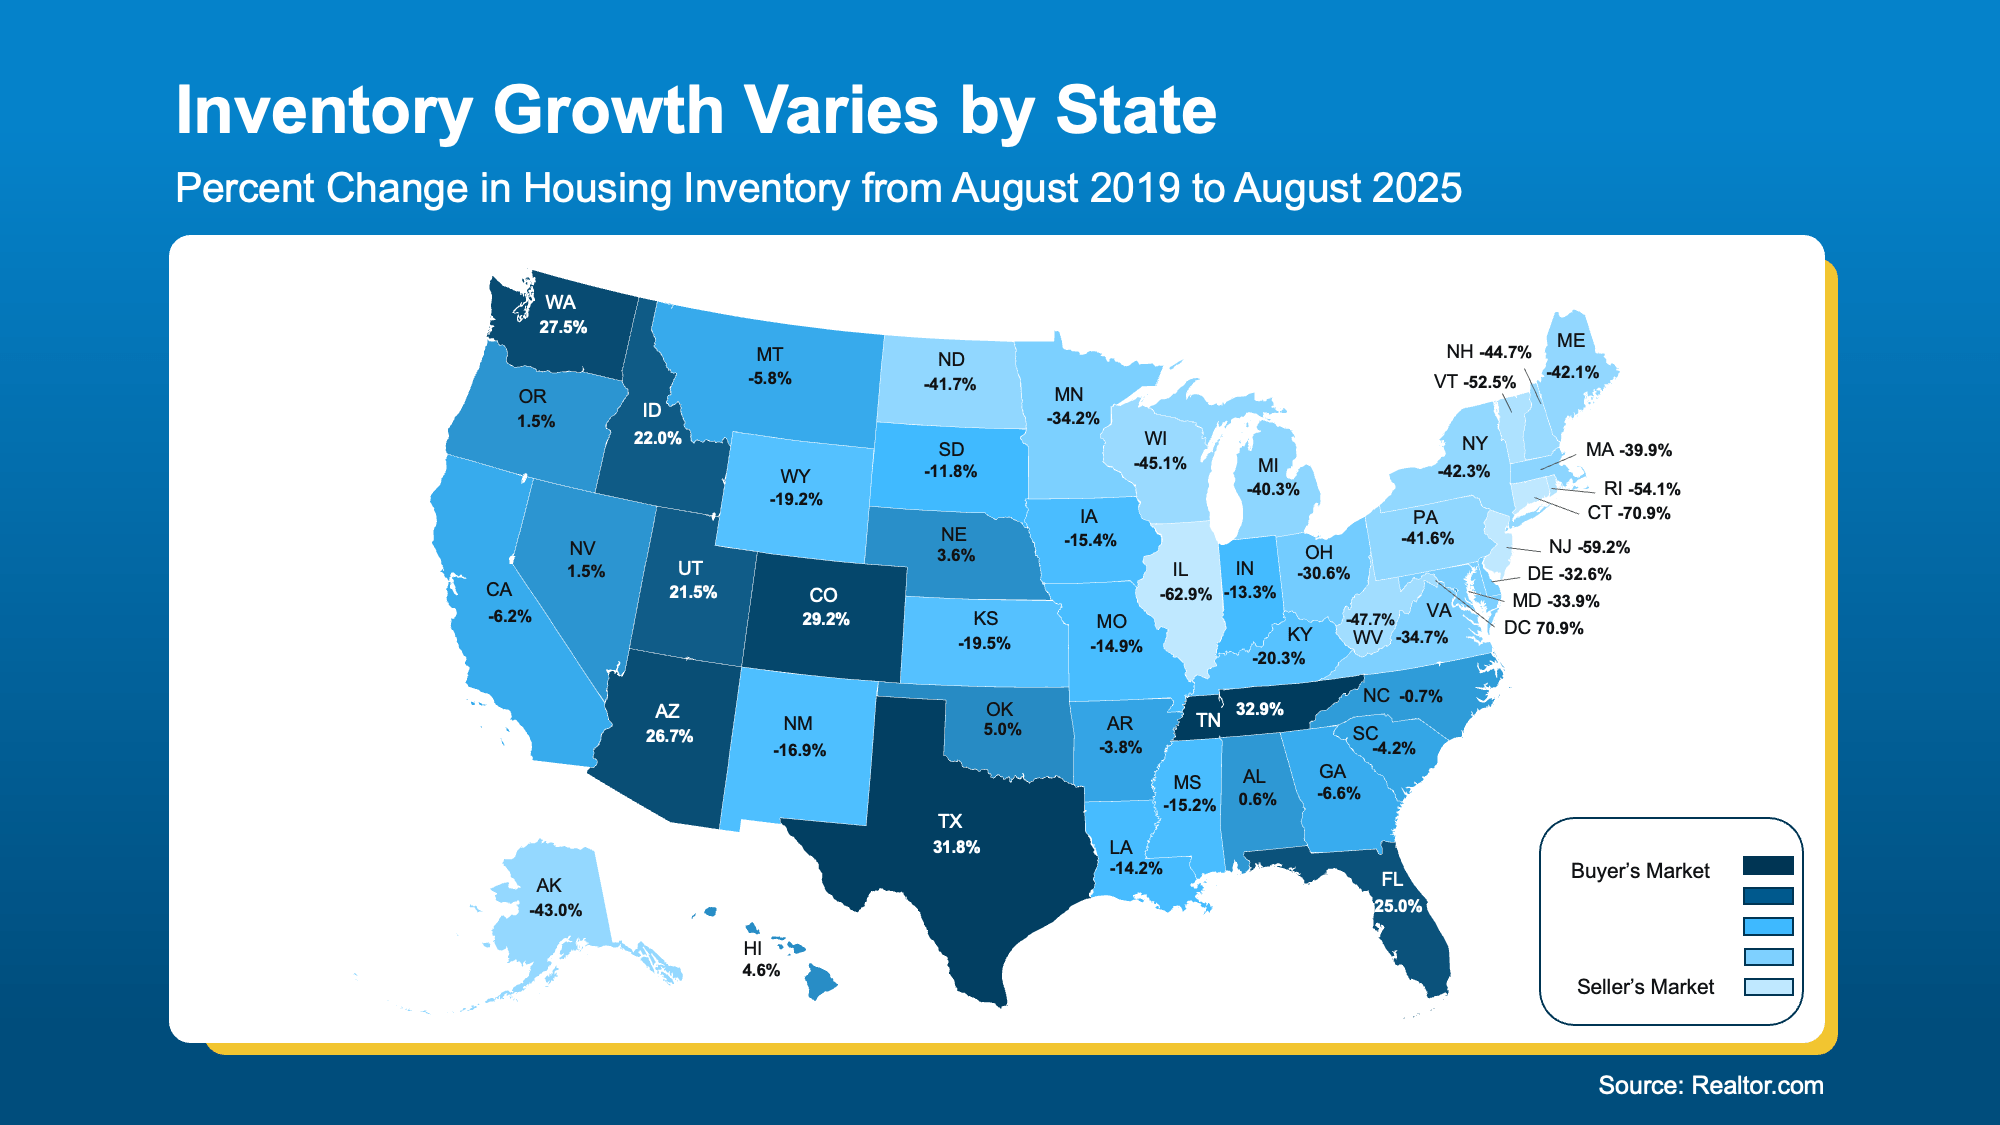
Inventory Sets the Stage
While the number of homes for sale has improved pretty much across the board, how much growth we’ve seen can look dramatically different based on where you live. And that impacts who has the leverage today.
This map uses data from Realtor.com to break it down:
- The darker shades of blue show where inventory has risen more than in other areas of the country. Buyers here have more options to choose from and should have an easier time finding a home, thereby leveraging their negotiating power.
- The lighter shades of blue are where inventory is still low. Sellers are more likely to sell quickly and make fewer concessions.
 Prices Follow Inventory
 Prices Follow Inventory
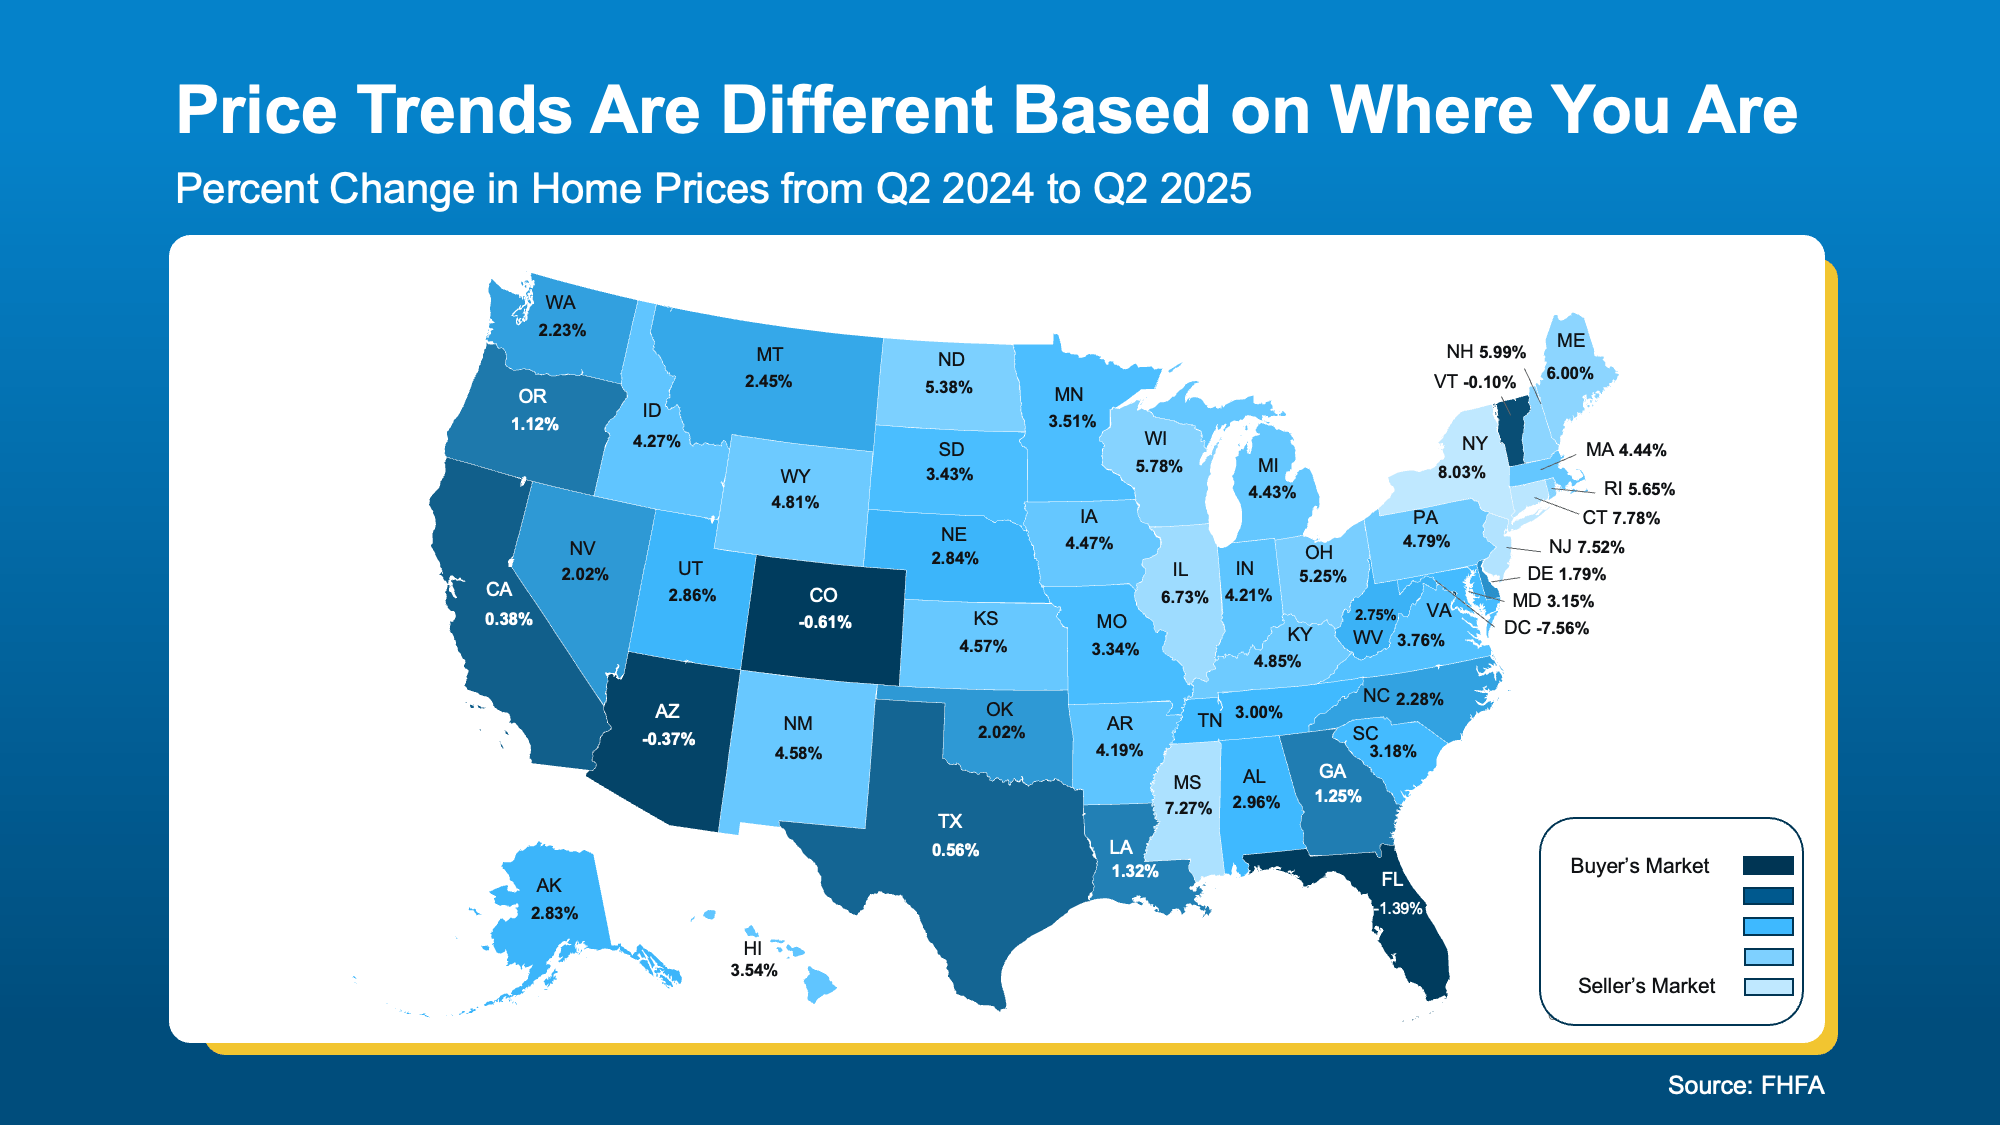
The second map tracks how home prices are shifting by state. Just like above, you can see the divide taking shape. Many of the same areas are darker blue. That’s because there’s such a close tie between inventory and prices. When inventory rises, prices moderate.
- The darker shades of blue indicate that prices are actually coming down slightly or remaining flat. With
- more homes for sale, sellers may have to lower their prices or offer concessions to close a deal, which benefits budget-conscious buyers.
- The lighter shades of blue indicate areas where prices are still rising due to low inventory. Sellers may still see buyers competing for homes, and that pushes prices higher.
Time on Market Tells the Same Story
 Time on Market Tells the Same Story
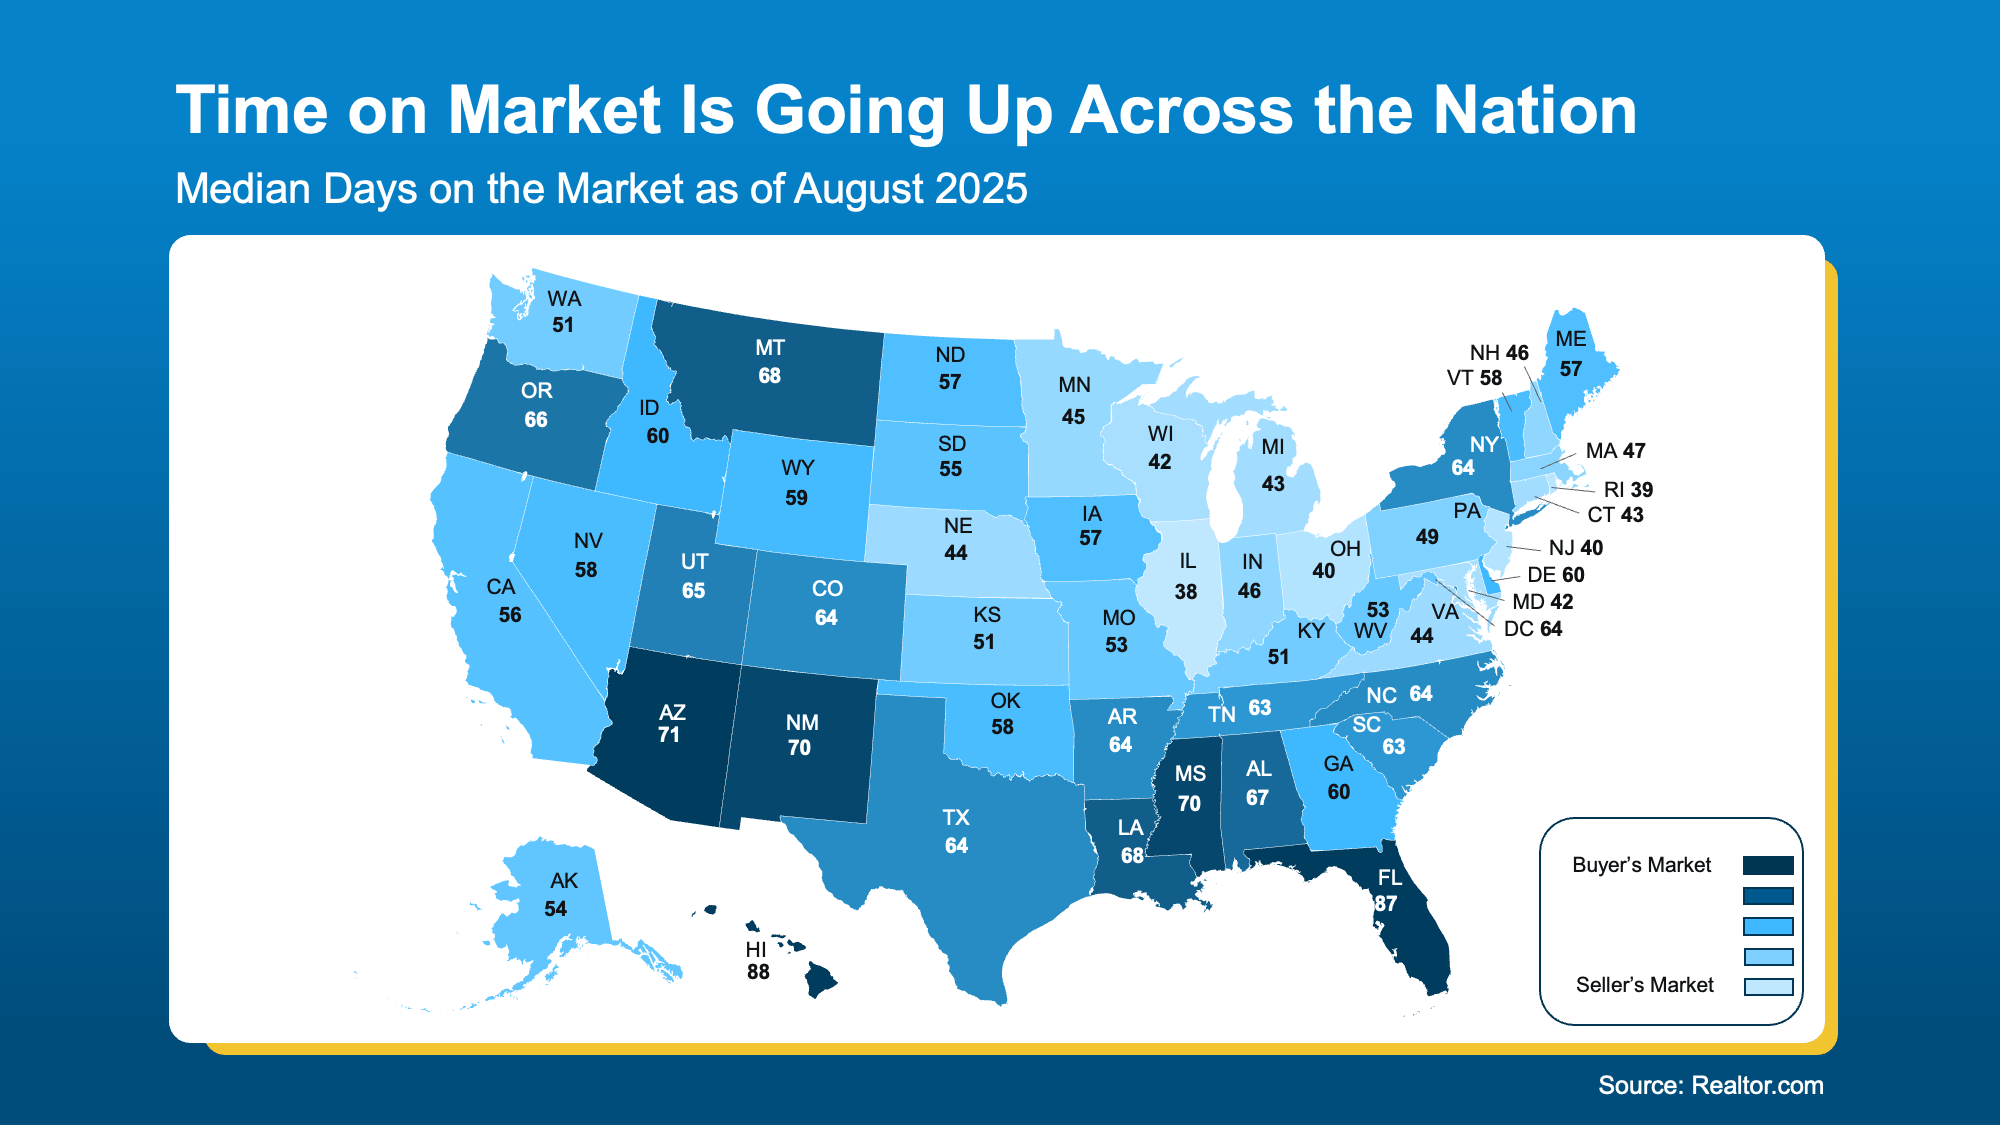
Finally, here’s how quickly homes are selling state by state. See the colors? For the most part, they follow a similar general pattern, with many of the darker blues concentrated in the lower half of the country. And here’s why.
Generally speaking, as inventory increases, homes tend to sell more slowly. That’s why some areas with more inventory see homes take longer to sell.
- The darker blues show where homes are staying on the market longer. That gives buyers more time and options, and signals sellers may need to adjust their expectations.
- The lighter blues indicate areas where homes are still selling quickly. Sellers there may feel more confident, and buyers may need to act fast.
 This explains why some sellers in these darker blue states are feeling frustrated when their listings linger, while others in tighter markets (like the lighter blue states) are still seeing their homes sell quickly.
Why an Agent’s Local Expertise Is the Key To Unlocking Today’s Market
Basically, the housing market is experiencing a divide. Conditions will vary significantly based on where you live, where you’re moving, and whether you’re buying or selling. While state-level information is helpful, what really matters is what’s happening in your town and neighborhood. And only a local agent truly has the information you need.
Bottom Line
Want to know what conditions look like in your neighborhood?
To understand which side of the market you’re on, let’s connect. We can walk through the numbers and what they mean for your next move.
